
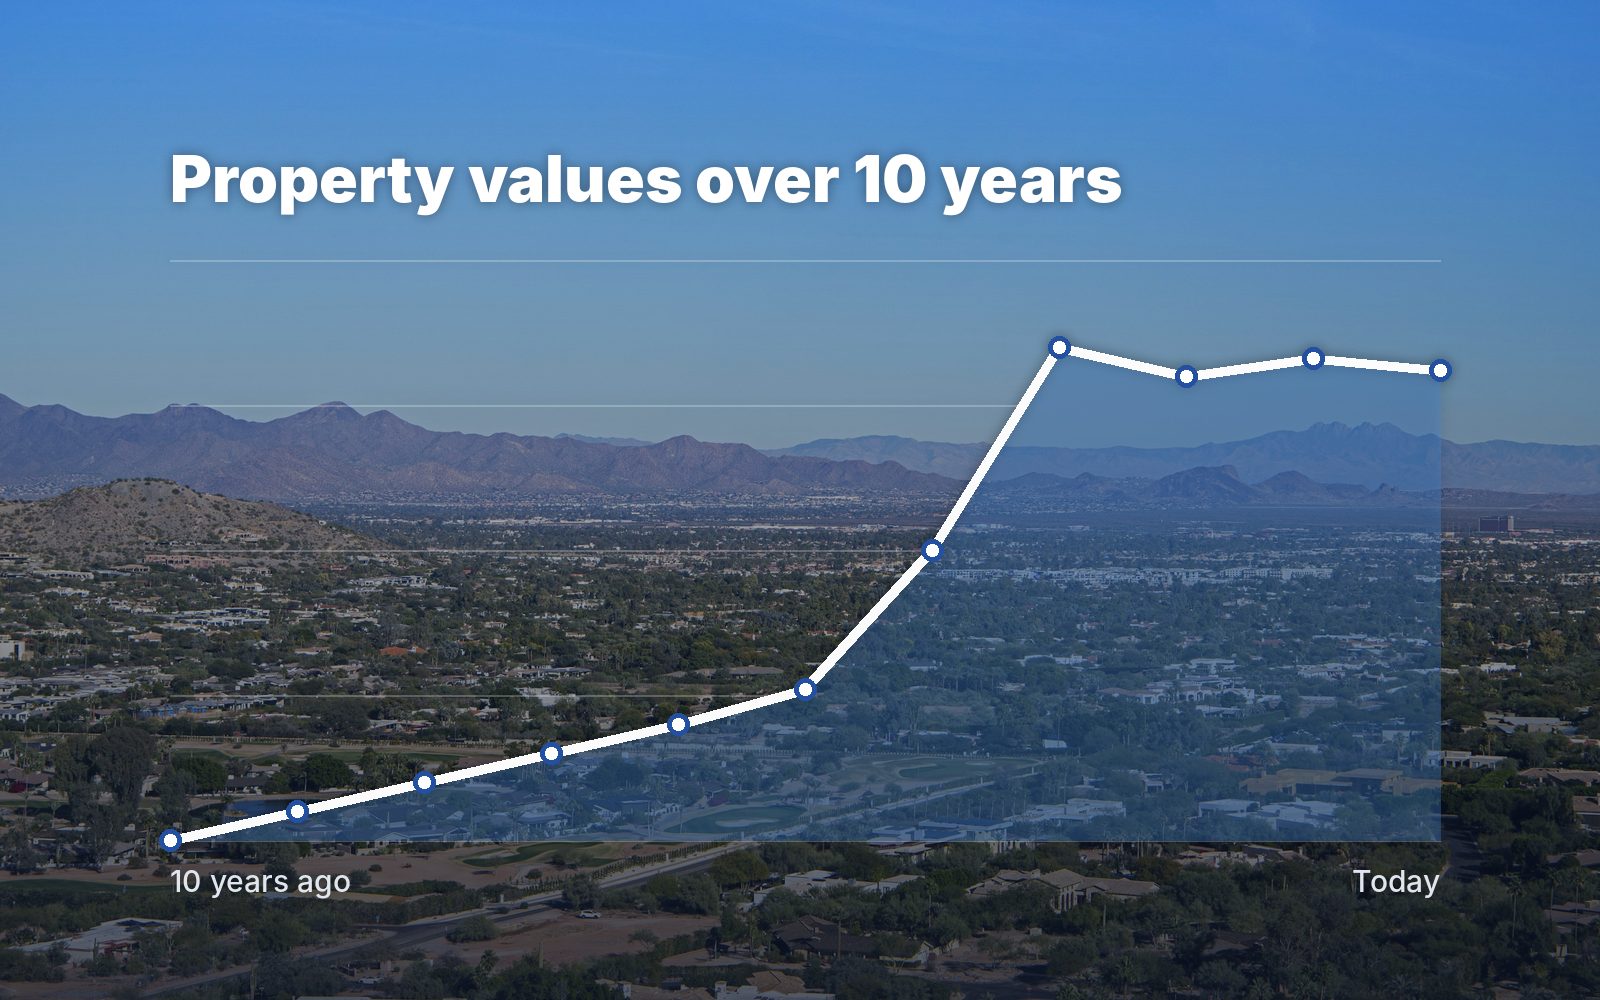
Over the past decade, home values across the Phoenix Mesa Chandler metro area have risen substantially overall, with a sharp run up early in the 2020s followed by flatter, choppier stretches since. You can see the trend yourself in the Federal Housing Finance Agency's House Price Index for the Phoenix Mesa Chandler metro. Long term trends are context, not a guarantee, and individual neighborhoods and home types move differently, so look at your own area's sales before drawing conclusions.
Understanding how Chandler area property values have trended over roughly the past decade offers useful context for buyers and sellers alike, not to predict the future, but to understand the market's underlying long term direction.
I'm not going to hand you a number from memory. Here's where to see the official data yourself, and how to read it.
Where to see the data
The Federal Housing Finance Agency publishes a House Price Index for metro areas, including Phoenix Mesa Chandler. It's built from repeat sales of the same homes, so it tracks how values change over time rather than how the mix of homes sold changes. The Federal Reserve Bank of St. Louis charts the Phoenix Mesa Chandler index going back decades, which makes the ten year picture easy to see.
What the long term picture shows
Over the past decade, values across the metro area have risen substantially overall. The early 2020s brought an unusually sharp run up, and the years since have been flatter and choppier, with some quarters up and some down. That shape matters more than any single number. It's a reminder that markets move in cycles, even when the long term direction is up.
Why Chandler has held up
Chandler has benefited from consistent population growth and significant employment expansion, particularly in its tech and manufacturing corridor, which has supported long term demand across most of the city. A strong job base is one of the factors that helps a market, though it's never a guarantee.
Long term trends vs. short term noise
Short term month to month fluctuations get a lot of attention, but long term trends tell a more useful story for buyers thinking about building equity and sellers understanding the true return on their original purchase.
If you're selling, the trend explains where your equity came from. If you're buying, it reminds you that a home is usually a long term decision, and short dips matter much less to someone who plans to stay for years.
Look up your own home's history
You can see public information about your own home on the Maricopa County Assessor's website, including the values the county has set each year. Keep in mind those values are for tax purposes and don't track the market exactly. The county also lists sales recorded for a property, which tells you what you or past owners paid. For what your home is worth today, you need recent sales of similar homes nearby, which is what I prepare before any pricing conversation.
What drove the big swings
Many things push values up and down: interest rates, how many people are moving to the area, how many homes are being built and how many owners decide to sell. When rates were very low and people moved here quickly, values rose fast. When rates rose, buying got more expensive and the pace changed. Understanding the forces helps you think about the trend without trying to predict next month.
Not every area or home moves the same
Not every Chandler neighborhood or home type has appreciated at the same rate. Age of the homes, lot size, HOA amenities like lakes or golf, and location relative to jobs and freeways all play a part. A metro wide index is the big picture. Your neighborhood's actual sales are what matter for your home.
| Big picture source | What it tells you |
|---|---|
| FHFA House Price Index | The long term trend for the metro area |
| Your neighborhood's closed sales | What homes like yours actually sold for |
| Current competition | What you're up against today |
What past appreciation does and doesn't mean
Long term appreciation trends don't guarantee future performance, but they do offer useful context on the underlying strength of the local employment base and demand that has historically supported this market. For reading current conditions, see How to read a Phoenix market update.
What this means if you bought long ago
If you've owned your home for many years, you may have a lot of equity and a large gain. As a CPA, I'd want you to understand the tax side before you sell. If the home has been your main residence for at least two of the last five years, you may be able to exclude up to $250,000 of gain from federal income tax, or $500,000 for a married couple filing jointly. Keep records of improvements, because they can raise your cost basis. Talk with your tax advisor about your situation.
What this means if you're buying now
Buying and selling both cost money, so the longer you plan to own, the more time your home has to grow past those costs. If you think you may move again within a couple of years, think carefully about whether buying or renting fits better. See Renting vs buying in Chandler, AZ.
The bottom line
Understanding your home's real value trajectory helps you make informed decisions, whether you're buying or selling. Let's look at the real numbers for your area together.
Let's take the confusion out of this decision, schedule your clarity call today.
Questions, answered.
Has the Chandler area appreciated over the past decade?
Overall yes, substantially, though with a sharp run up early in the 2020s and flatter, choppier stretches since. The FHFA House Price Index shows the metro area trend.
Do all Chandler neighborhoods appreciate at the same rate?
No, appreciation varies by specific neighborhood, home type, and amenities. I'll help you understand the trend for homes like yours.
Should I use past appreciation to predict future value?
Past performance offers context, not a guarantee, I always encourage grounding decisions in current data and your personal goals rather than assuming past trends will repeat.
Where can I see official home price data for the Phoenix area?
The Federal Housing Finance Agency's House Price Index covers the Phoenix Mesa Chandler metro area, and the St. Louis Fed charts it over time.
How do I find out what my own home is worth?
Look at recent closed sales of homes like yours nearby. I can put that together for you with the adjustments explained.
Want to talk it through?
Bring me the specifics of your situation and I will tell you straight what I would do. No pitch, nothing to sign, and no obligation to work with me afterward.
See your home's value history